Working as if they are engineers aiming to analyze and then improve …
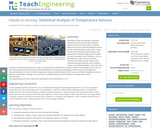
Working as if they are engineers aiming to analyze and then improve data collection devices for precision agriculture, students determine how accurate temperature sensors are by comparing them to each other. Teams record soil temperature data during a class period while making changes to the samples to mimic real-world crop conditions—such as the addition of water and heat and the removal of the heat. Groups analyze their collected data by finding the mean, median, mode, and standard deviation. Then, the class combines all the team data points in order to compare data collected from numerous devices and analyze the accuracy of their recording devices by finding the standard deviation of temperature readings at each minute. By averaging the standard deviations of each minute’s temperature reading, students determine the accuracy of their temperature sensors. Students present their findings and conclusions, including making recommendations for temperature sensor improvements.
Students overlay USGS topographic maps into Google Earth’s satellite imagery. By analyzing …
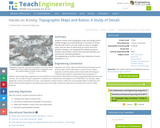
Students overlay USGS topographic maps into Google Earth’s satellite imagery. By analyzing Denali, a mountain in Alaska, they discover how to use map scales as ratios to navigate maps, and use rates to make sense of contour lines and elevation changes in an integrated GIS software program. Students also problem solve to find potential pathways up a mountain by calculating gradients.
Prepared with pre-algebra or algebra 1 classes in mind, this module leads …
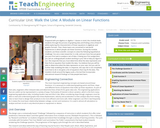
Prepared with pre-algebra or algebra 1 classes in mind, this module leads students through the process of graphing data and finding a line of best fit while exploring the characteristics of linear equations in algebraic and graphic formats. Then, these topics are connected to real-world experiences in which people use linear functions. During the module, students use these scientific concepts to solve the following hypothetical challenge: You are a new researcher in a lab, and your boss has just given you your first task to analyze a set of data. It being your first assignment, you ask an undergraduate student working in your lab to help you figure it out. She responds that you must determine what the data represents and then find an equation that models the data. You believe that you will be able to determine what the data represents on your own, but you ask for further help modeling the data. In response, she says she is not completely sure how to do it, but gives a list of equations that may fit the data. This module is built around the legacy cycle, a format that incorporates educational research feindings on how people best learn.
Students collect a large set of data (approximately 60 sets) of individual …
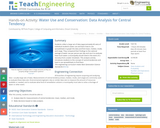
Students collect a large set of data (approximately 60 sets) of individual student’s water use and learn how to use spreadsheets to graph the data and find mean, median, mode, and range. They compared their findings to the national average of water use per person per day and use it to evaluate how much water a municipality would need in the event of a recovery from a water shutdown. This analysis activity introduces students to the concept of central tendencies and how to use spreadsheets to find them.
No restrictions on your remixing, redistributing, or making derivative works. Give credit to the author, as required.
Your remixing, redistributing, or making derivatives works comes with some restrictions, including how it is shared.
Your redistributing comes with some restrictions. Do not remix or make derivative works.
Most restrictive license type. Prohibits most uses, sharing, and any changes.
Copyrighted materials, available under Fair Use and the TEACH Act for US-based educators, or other custom arrangements. Go to the resource provider to see their individual restrictions.