In this simulation of a doctor's office, students play the roles of …
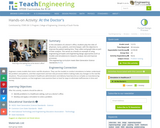
In this simulation of a doctor's office, students play the roles of physician, nurse, patients, and time-keeper, with the objective to improve the patient waiting time. They collect and graph data as part of their analysis. This serves as a hands-on example of using engineering principles and engineering design approaches (such as models and simulations) to research, analyze, test and improve processes.
Students use their senses to describe what the weather is doing and …
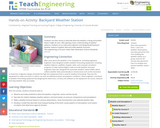
Students use their senses to describe what the weather is doing and predict what it might do next. After gaining a basic understanding of weather patterns, students act as state park engineers and design/build "backyard weather stations" to gather data to make actual weather forecasts.
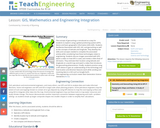
Students are introduced to the "Walk the Line" challenge question. They write …
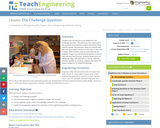
Students are introduced to the "Walk the Line" challenge question. They write journal responses to the question and brainstorm what information they need to answer the question. Ideas are shared with the class (or in pairs and then to the class, if class size is large). Then students read an interview with an engineer to gain a professional perspective on linear data sets and best-fit lines. Students brainstorm for additional ideas and add them to the list. With the teacher's guidance, students organize the ideas into logical categories of needed knowledge.
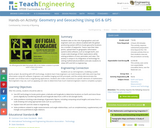
As if they are environmental engineers, student pairs are challenged to use …
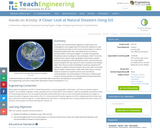
As if they are environmental engineers, student pairs are challenged to use Google Earth Pro (free) GIS software to view and examine past data on hurricanes and tornados in order to (hypothetically) advise their state government on how to proceed with its next-year budget—to answer the question: should we reduce funding for natural disaster relief? To do this, students learn about maps, geographic information systems (GIS) and the global positioning system (GPS), and how they are used to deepen the way maps are used to examine and analyze data. Then they put their knowledge to work by using the GIS software to explore historical severe storm (tornado, hurricane) data in depth. Student pairs confer with other teams, conduct Internet research on specific storms and conclude by presenting their recommendations to the class. Students gain practice and perspective on making evidence-based decisions. A slide presentation as well as a student worksheet with instructions and questions are provided.
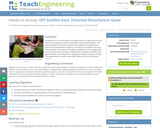
Students pass around and distort messages written on index cards to learn …
Students pass around and distort messages written on index cards to learn how we use signals from GPS occultations to study the atmosphere. The cards represent information sent from GPS satellites being distorted as they pass through different locations in the Earth's atmosphere and reach other satellites. Analyzing GPS occultations enables better global weather forecasting, storm tracking and climate change monitoring.
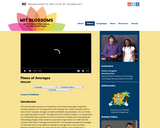
This learning video presents an introduction to the Flaws of Averages using …
This learning video presents an introduction to the Flaws of Averages using three exciting examples: the ''crossing of the river'' example, the ''cookie'' example, and the ''dance class'' example. Averages are often worthwhile representations of a set of data by a single descriptive number. The objective of this module, however, is to simply point out a few pitfalls that could arise if one is not attentive to details when calculating and interpreting averages. The essential prerequisite knowledge for this video lesson is the ability to calculate an average from a set of numbers. During this video lesson, students will learn about three flaws of averages: (1) The average is not always a good description of the actual situation, (2) The function of the average is not always the same as the average of the function, and (3) The average depends on your perspective. To convey these concepts, the students are presented with the three real world examples mentioned above.
The concept of geocaching is introduced as a way for students to …
The concept of geocaching is introduced as a way for students to explore using a global positioning system (GPS) device and basic geographic information (GIS) skills. Students familiarize themselves with GPS, GIS, and geocaching as well as the concepts of latitude and longitude. They develop the skills and concepts needed to complete the associated activity while considering how these technologies relate to engineering. Students discuss images associated with GPS, watch a video on how GPS is used, and review a slide show of GIS basics. They estimate their location using latitude and longitude on a world map and watch a video that introduces the geocaching phenomenon. Finally, students practice using a GPS device to gain an understanding of the technology and how location and direction features work while sending and receiving data to a GIS such as Google Earth.
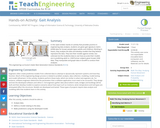
In this open-ended, hands-on activity that provides practice in engineering data analysis, …
In this open-ended, hands-on activity that provides practice in engineering data analysis, students are given gait signature metric (GSM) data for known people types (adults and children). Working in teams, they analyze the data and develop models that they believe represent the data. They test their models against similar, but unknown (to the students) data to see how accurate their models are in predicting adult vs. child human subjects given known GSM data. They manipulate and graph data in Excel® to conduct their analyses.
Students take on the role of geographers and civil engineers and use …
Students take on the role of geographers and civil engineers and use a device enabled with the global positioning system (GPS) to locate geocache locations via a number of waypoints. Teams save their data points, upload them to geographic information systems (GIS) software, such as Google Earth, and create scale drawings of their explorations while solving problems of area, perimeter and rates. The activity is unique in its integration of technology for solving mathematical problems and asks students to relate GPS and GIS to engineering.
This 10-day module builds on Grade 2 concepts about data, graphing, and …
This 10-day module builds on Grade 2 concepts about data, graphing, and line plots. The two topics in this module focus on generating and analyzing categorical and measurement data. By the end of the module, students are working with a mixture of scaled picture graphs, bar graphs, and line plots to problem solve using both categorical and measurement data.
In this module, students move from simply representing data into analysis of …
In this module, students move from simply representing data into analysis of data. Students begin to think and reason statistically, first by recognizing a statistical question as one that can be answered by collecting data. Students learn that the data collected to answer a statistical question has a distribution that is often summarized in terms of center, variability, and shape. Throughout the module, students see and represent data distributions using dot plots and histograms. They study quantitative ways to summarize numerical data sets in relation to their context and to the shape of the distribution. As the module ends, students synthesize what they have learned as they connect the graphical, verbal, and numerical summaries to each other within situational contexts, culminating with a major project.
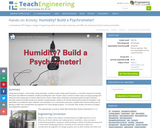
Using thermometers, cotton balls, string and water, students make simple psychrometers—a tool …
Using thermometers, cotton balls, string and water, students make simple psychrometers—a tool that measures humidity. They learn the difference between relative humidity (the ratio of water vapor content to water vapor carrying capacity) and dew point (the temperature at which dew forms). Teams collect data using their homemade psychrometers and then calculate relative humidity inside and outside, comparing their results to an off-the-shelf psychrometer (if available). A lab worksheet is provided for data collection and calculation. As a real-world connection, students learn that humidity and air density is taken into consideration by engineers for many design projects. To conclude, they answer and discuss analysis and application questions.
This course was originally developed for the Open Course Library project. The …
This course was originally developed for the Open Course Library project. The text used is Math in Society, edited by David Lippman, Pierce College Ft Steilacoom. Development of this book was supported, in part, by the Transition Math Project and the Open Course Library Project. Topics covered in the course include problem solving, voting theory, graph theory, growth models, finance, data collection and description, and probability.
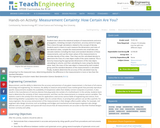
Students learn about the statistical analysis of measurements and error propagation, reviewing …
Students learn about the statistical analysis of measurements and error propagation, reviewing concepts of precision, accuracy and error types. This is done through calculations related to the concept of density. Students work in teams to each measure the dimensions and mass of five identical cubes, compile the measurements into small data sets, calculate statistics including the mean and standard deviation of these measurements, and use the mean values of the measurements to calculate density of the cubes. Then they use this calculated density to determine the mass of a new object made of the same material. This is done by measuring the appropriate dimensions of the new object, calculating its volume, and then calculating its mass using the density value. Next, the mass of the new object is measured by each student group and the standard deviation of the measurements is calculated. Finally, students determine the accuracy of the calculated mass by comparing it to the measured mass, determining whether the difference in the measurements is more or less than the standard deviation.
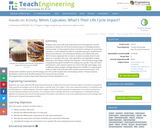
Students learn about life-cycle assessment and how engineers use this technique to …
Students learn about life-cycle assessment and how engineers use this technique to determine the environmental impact of everyday products and processes. As they examine what’s involved in making and consuming cupcakes, a snack enjoyed by millions of people every year, students learn about the production, use and disposal phases of an object’s life cycle. With the class organized into six teams, students calculate data for each phase of a cupcake’s life cycle—wet ingredients, dry ingredients, baking materials, oven baking, frosting, liner disposal—and calculate energy usage and greenhouse gases emitted from making one cupcake. They use ratios and fractions, and compare options for some of the life-cycle stages, such as different paper wrapper endings (disposal to landfills or composting) in order to make a life-cycle plan with a lower environmental impact. This activity opens students’ eyes to see the energy use in the cradle-to-grave lives of everyday products. Pre/post-quizzes, worksheets, activity cards, Excel® workbook and visual aids are provided.
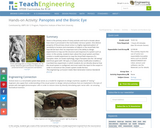
Vision is the primary sense of many animals and much is known …
Vision is the primary sense of many animals and much is known about how vision is processed in the mammalian nervous system. One distinct property of the primary visual cortex is a highly organized pattern of sensitivity to location and orientation of objects in the visual field. But how did we learn this? An important tool is the ability to design experiments to map out the structure and response of a system such as vision. In this activity, students learn about the visual system and then conduct a model experiment to map the visual field response of a Panoptes robot. (In Greek mythology, Argus Panoptes was the "all-seeing" watchman giant with 100 eyes.) A simple activity modification enables a true black box experiment, in which students do not directly observe how the visual system is configured, and must match the input to the output in order to reconstruct the unseen system inside the box.
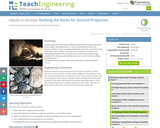
Student teams assign importance factors, called "desirability points," the rock properties found …
Student teams assign importance factors, called "desirability points," the rock properties found in the previous lesson/activity in order to mathematically determine the overall best rocks for building caverns within. They learn the real-world connections and relationships between the rock and the important engineering properties for designing and building caverns (or tunnels, mines, building foundations, etc.).
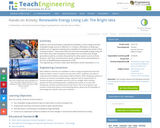
Students become familiar with the online Renewable Energy Living Lab interface and …
Students become familiar with the online Renewable Energy Living Lab interface and access its real-world solar energy data to evaluate the potential for solar generation in various U.S. locations. They become familiar with where the most common sources of renewable energy are distributed across the U.S. Through this activity, students and teachers gain familiarity with the living lab's GIS graphic interface and query functions, and are exposed to the available data in renewable energy databases, learning how to query to find specific information for specific purposes. The activity is intended as a "training" activity prior to conducting activities such as The Bright Idea activity, which includes a definitive and extensive end product (a feasibility plan) for students to create.
Students use real-world data to evaluate the feasibility of solar energy and …
Students use real-world data to evaluate the feasibility of solar energy and other renewable energy sources in different U.S. locations. Working in small groups, students act as engineers evaluating the suitability of installing solar panels at four company locations. They access data from the online Renewable Energy Living Lab from which they make calculations and analyze how successful solar energy generation would be, as well as the potential for other power sources at those locations. Then they summarize their results, analysis and recommendations in the form of feasibility plans prepared for a CEO.
Many of today's popular sports are based around the use of balls, …
Many of today's popular sports are based around the use of balls, yet none of the balls are completely alike. In fact, they are all designed with specific characteristics in mind and are quite varied. Students investigate different balls' abilities to bounce and represent the data they collect graphically.
No restrictions on your remixing, redistributing, or making derivative works. Give credit to the author, as required.
Your remixing, redistributing, or making derivatives works comes with some restrictions, including how it is shared.
Your redistributing comes with some restrictions. Do not remix or make derivative works.
Most restrictive license type. Prohibits most uses, sharing, and any changes.
Copyrighted materials, available under Fair Use and the TEACH Act for US-based educators, or other custom arrangements. Go to the resource provider to see their individual restrictions.