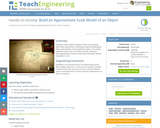
Students create models of objects of their choice, giving them skills and …
Students create models of objects of their choice, giving them skills and practice in techniques used by professionals. They make sketches as they build their objects. This activity facilitates a discussion on models and their usefulness.
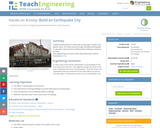
Students build miniature model cities using sugar, bouillon and gelatin cubes. The …
Students build miniature model cities using sugar, bouillon and gelatin cubes. The cities are put through simulated earthquakes to see which cube structures withstand the shaking movements the best.
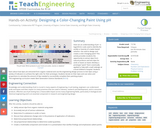
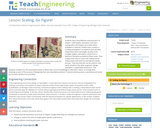
How can an understanding of pH—a logarithmic scale used to identify the …
How can an understanding of pH—a logarithmic scale used to identify the acidity or basicity of a water-based solution—be used to design and create a color-changing paint? This activity provides students the opportunity to extract dyes from natural products and test dyes for acids or bases as teams develop a prototype “paint” that is eventually applied to help with a wall redesign at a local children’s hospital. Students learn about how dyes are extracted from organic material and use the engineering design process to test dyes using a variety of indicators to achieve the right color for their prototype. Students iterate on their dyes and use ratios and proportions to calculate the amount of dye needed to successfully complete their painting project.
In Module 4, students deepen their understanding of ratios and proportional relationships …
In Module 4, students deepen their understanding of ratios and proportional relationships from Module 1 by solving a variety of percent problems. They convert between fractions, decimals, and percents to further develop a conceptual understanding of percent and use algebraic expressions and equations to solve multi-step percent problems. An initial focus on relating 100% to the whole serves as a foundation for students. Students begin the module by solving problems without using a calculator to develop an understanding of the reasoning underlying the calculations. Material in early lessons is designed to reinforce students understanding by having them use mental math and basic computational skills. To develop a conceptual understanding, students use visual models and equations, building on their earlier work with these. As the lessons and topics progress and students solve multi-step percent problems algebraically with numbers that are not as compatible, teachers may let students use calculators so that their computational work does not become a distraction.
Students learn about radar imaging and its various military and civilian applications …
Students learn about radar imaging and its various military and civilian applications that include recognition and detection of human-made targets, and the monitoring of space, deforestation and oil spills. They learn how the concepts of similarity and scaling are used in radar imaging to create three-dimensional models of various targets. Students apply the critical attributes of similar figures to create scale models of a radar imaging scenario using infrared range sensors (to emulate radar functions) and toy airplanes (to emulate targets). They use technology tools to measure angles and distances, and relate the concept of similar figures to real-world applications.
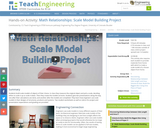
Students build scale models of objects of their choice. In class they …
Students build scale models of objects of their choice. In class they measure the original object and pick a scale, deciding either to scale it up or scale it down. Then they create the models at home. Students give two presentations along the way, one after their calculations are done, and another after the models are completed. They learn how engineers use scale models in their designs of structures, products and systems. Two student worksheets as well as rubrics for project and presentation expectations and grading are provided.
Students learn how different characteristics of shapes—side lengths, perimeter and area—change when …
Students learn how different characteristics of shapes—side lengths, perimeter and area—change when the shapes are scaled, either enlarged or reduced. Student pairs conduct a “scaling investigation” to measure and calculate shape dimensions (rectangle, quarter circle, triangle; lengths, perimeters, areas) from a bedroom floorplan provided at three scales. They analyze their data to notice the mathematical relationships that hold true during the scaling process. They see how this can be useful in real-world situations like when engineers design wearable or implantable biosensors. This prepares students for the associated activity in which they use this knowledge to help them reduce or enlarge their drawings as part of the process of designing their own wearables products. Pre/post-activity quizzes, a worksheet and wrap-up concepts handout are provided.
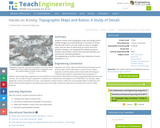
Students overlay USGS topographic maps into Google Earth’s satellite imagery. By analyzing …
Students overlay USGS topographic maps into Google Earth’s satellite imagery. By analyzing Denali, a mountain in Alaska, they discover how to use map scales as ratios to navigate maps, and use rates to make sense of contour lines and elevation changes in an integrated GIS software program. Students also problem solve to find potential pathways up a mountain by calculating gradients.
No restrictions on your remixing, redistributing, or making derivative works. Give credit to the author, as required.
Your remixing, redistributing, or making derivatives works comes with some restrictions, including how it is shared.
Your redistributing comes with some restrictions. Do not remix or make derivative works.
Most restrictive license type. Prohibits most uses, sharing, and any changes.
Copyrighted materials, available under Fair Use and the TEACH Act for US-based educators, or other custom arrangements. Go to the resource provider to see their individual restrictions.