This final lesson in the unit culminates with the Go Public phase …
This final lesson in the unit culminates with the Go Public phase of the legacy cycle. In the associated activities, students use linear models to depict Hooke's law as well as Ohm's law. To conclude the lesson, students apply they have learned throughout the unit to answer the grand challenge question in a writing assignment.
In this simulation of a doctor's office, students play the roles of …
In this simulation of a doctor's office, students play the roles of physician, nurse, patients, and time-keeper, with the objective to improve the patient waiting time. They collect and graph data as part of their analysis. This serves as a hands-on example of using engineering principles and engineering design approaches (such as models and simulations) to research, analyze, test and improve processes.
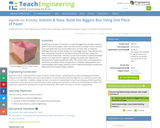
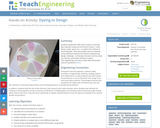
Student pairs are given 10 minutes to create the biggest box possible …
Student pairs are given 10 minutes to create the biggest box possible using one piece of construction paper. Teams use only scissors and tape to each construct a box and determine how much puffed rice it can hold. Then, to meet the challenge, they improve their designs to create bigger boxes. They plot the class data, comparing measured to calculated volumes for each box, seeing the mathematical relationship. They discuss how the concepts of volume and design iteration are important for engineers. Making 3-D shapes also supports the development of spatial visualization skills. This activity and its associated lesson and activity all employ volume and geometry to cultivate seeing patterns and understanding scale models, practices used in engineering design to analyze the effectiveness of proposed design solutions.
Students apply their knowledge of linear regression and design to solve a …
Students apply their knowledge of linear regression and design to solve a real-world challenge to create a better packing solution for shipping cell phones. They use different materials, such as cardboard, fabric, plastic, and rubber bands to create new “composite material” packaging containers. Teams each create four prototypes made of the same materials and constructed in the same way, with the only difference being their weights, so each one is fabricated with a different amount of material. They test the three heavier prototype packages by dropping them from different heights to see how well they protect a piece of glass inside (similar in size to iPhone 6). Then students use linear regression to predict from what height they can drop the fourth/final prototype of known mass without the “phone” breaking. Success is not breaking the glass but not underestimating the height by too much either, which means using math to accurately predict the optimum drop height.
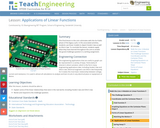
This lab demonstrates Ohm's law as students set up simple circuits each …
This lab demonstrates Ohm's law as students set up simple circuits each composed of a battery, lamp and resistor. Students calculate the current flowing through the circuits they create by solving linear equations. After solving for the current, I, for each set resistance value, students plot the three points on a Cartesian plane and note the line that is formed. They also see the direct correlation between the amount of current flowing through the lamp and its brightness.
Students are introduced to the "Walk the Line" challenge question. They write …
Students are introduced to the "Walk the Line" challenge question. They write journal responses to the question and brainstorm what information they need to answer the question. Ideas are shared with the class (or in pairs and then to the class, if class size is large). Then students read an interview with an engineer to gain a professional perspective on linear data sets and best-fit lines. Students brainstorm for additional ideas and add them to the list. With the teacher's guidance, students organize the ideas into logical categories of needed knowledge.
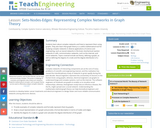
Students learn about complex networks and how to represent them using graphs. …
Students learn about complex networks and how to represent them using graphs. They also learn that graph theory is a useful mathematical tool for studying complex networks in diverse applications of science and engineering, such as neural networks in the brain, biochemical reaction networks in cells, communication networks, such as the internet, and social networks. Topics covered include set theory, defining a graph, as well as defining the degree of a node and the degree distribution of a graph.
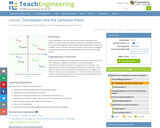
A brief refresher on the Cartesian plane includes how points are written …
A brief refresher on the Cartesian plane includes how points are written in (x, y) format and oriented to the axes, and which directions are positive and negative. Then students learn about what it means for a relation to be a function and how to determine domain and range of a set of data points.
Using a website simulation tool, students build on their understanding of random …
Using a website simulation tool, students build on their understanding of random processes on networks to interact with the graph of a social network of individuals and simulate the spread of a disease. They decide which two individuals on the network are the best to vaccinate in an attempt to minimize the number of people infected and "curb the epidemic." Since the results are random, they run multiple simulations and compute the average number of infected individuals before analyzing the results and assessing the effectiveness of their vaccination strategies.
Students design and build model landfills using materials similar to those used …
Students design and build model landfills using materials similar to those used by engineers for full-scale landfills. Their completed small-size landfills are "rained" on and subjected to other erosion processes. The goal is to create landfills that hold the most garbage, minimize the cost to build and keep trash and contaminated water inside the landfill to prevent it from causing environmental damage. Teams create designs within given budgets, test the landfills' performance, and graph and compare designs for capacity, cost and performance.
Student teams design and create LEGO® structures to house and protect temperature …
Student teams design and create LEGO® structures to house and protect temperature sensors. They leave their structures in undisturbed locations for a week, and regularly check and chart the temperatures. This activity engages students in the design and analysis aspects of engineering.
Students use two different methods to determine the densities of a variety …
Students use two different methods to determine the densities of a variety of materials and objects. The first method involves direct measurement of the volumes of objects that have simple geometric shapes. The second is the water displacement method, used to determine the volumes of irregularly shaped objects. After the densities are determined, students create x-y scatter graphs of mass versus volume, which reveal that objects with densities less than water (floaters) lie above the graph's diagonal (representing the density of water), and those with densities greater than water (sinkers) lie below the diagonal.
Students experiment with various ways to naturally dye materials using sources found …
Students experiment with various ways to naturally dye materials using sources found in nature—roots, leaves, seeds, spices, etc.—as well as the method of extracting dyes. Then they analyze various materials using statistical methods and tackle an engineering design challenge—to find dyes that best suit the needs of a startup sustainable clothing company.
Students apply what they know about light polarization and attenuation (learned in …
Students apply what they know about light polarization and attenuation (learned in the associated lesson) to design, build, test, refine and then advertise their prototypes for more effective sunglasses. Presented as a hypothetical design scenario, students act as engineers who are challenged to create improved sunglasses that reduce glare and lower light intensity while increasing eye protection from UVA and UVB radiation compared to an existing model of sunglasses—and make them as inexpensive as possible. They use a light meter to measure and compare light intensities through the commercial sunglasses and their prototype lenses. They consider the project requirements and constraints in their designs. They brainstorm and evaluate possible design ideas. They keep track of materials costs. They create and present advertisements to the class that promote the sunglasses benefits, using collected data to justify their claims. A grading rubric and reflection handout are provided.
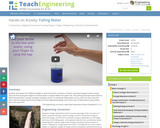
Students drop water from different heights to demonstrate the conversion of water's …
Students drop water from different heights to demonstrate the conversion of water's potential energy to kinetic energy. They see how varying the height from which water is dropped affects the splash size. They follow good experiment protocol, take measurements, calculate averages and graph results. In seeing how falling water can be used to do work, they also learn how this energy transformation figures into the engineering design and construction of hydroelectric power plants, dams and reservoirs.
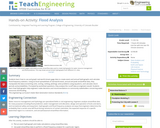
Students learn how to use and graph real-world stream gage data to …
Students learn how to use and graph real-world stream gage data to create event and annual hydrographs and calculate flood frequency statistics. Using an Excel spreadsheet of real-world event, annual and peak streamflow data, they manipulate the data (converting units, sorting, ranking, plotting), solve problems using equations, and calculate return periods and probabilities. Prompted by worksheet questions, they analyze the runoff data as engineers would. Students learn how hydrographs help engineers make decisions and recommendations to community stakeholders concerning water resources and flooding.
Students learn about four forms of equations: direct variation, slope-intercept form, standard …
Students learn about four forms of equations: direct variation, slope-intercept form, standard form and point-slope form. They graph and complete problem sets for each, converting from one form of equation to another, and learning the benefits and uses of each.
Students use graph theory to create social graphs for their own social …
Students use graph theory to create social graphs for their own social networks and apply what learn to create a graph representing the social dynamics found in a dramatic text. Students then derive meaning based on what they know about the text from the graphs they created. Students learn graph theory vocabulary, as well as engineering applications of graph theory.
Students learn about an important characteristic of lines: their slopes. Slope can …
Students learn about an important characteristic of lines: their slopes. Slope can be determined either in graphical or algebraic form. Slope can also be described as positive, negative, zero or undefined. Students get an explanation of when and how these different types of slope occur. Finally, they learn how slope relates to parallel and perpendicular lines. When two lines are parallel, they have the same slope and when they are perpendicular their slopes are negative reciprocals of one another.
No restrictions on your remixing, redistributing, or making derivative works. Give credit to the author, as required.
Your remixing, redistributing, or making derivatives works comes with some restrictions, including how it is shared.
Your redistributing comes with some restrictions. Do not remix or make derivative works.
Most restrictive license type. Prohibits most uses, sharing, and any changes.
Copyrighted materials, available under Fair Use and the TEACH Act for US-based educators, or other custom arrangements. Go to the resource provider to see their individual restrictions.