Students learn the physical properties of sound, how it travels and how …
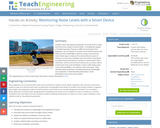
Students learn the physical properties of sound, how it travels and how noise impacts human health—including the quality of student learning. They learn different techniques that engineers use in industry to monitor noise level exposure and then put their knowledge to work by using a smart phone noise meter app to measure the noise level at an area of interest, such as busy roadways near the school. They devise an experimental procedure to measure sound levels in their classroom, at the source of loud noise (such as a busy road or construction site), and in between. Teams collect data using smart phones/tablets, microphones and noise apps. They calculate wave properties, including frequency, wavelength and amplitude. A PowerPoint® presentation, three worksheets and a quiz are provided.
This lesson teaches students how to make decisions in the face of …
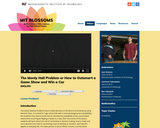
This lesson teaches students how to make decisions in the face of uncertainty by using decision trees. It is aimed for high school kids with a minimal background in probability; the students only need to know how to calculate the probability of two uncorrelated events both occurring (ie flipping 2 heads in a row). Over the course of this lesson, students will learn about the role of uncertainty in decision making, how to make and use a decision tree, how to use limiting cases to develop an intuition, and how this applies to everyday life. The video portion is about fifteen minutes, and the whole lesson, including activities, should be completed in about forty-five minutes. Some of the activities call for students to work in pairs, but a larger group is also okay, especially for the discussion centered activities. The required materials for this lesson are envelopes, small prizes, and some things similar in size and shape to the prize.
Natural Resources Biometrics begins with a review of descriptive statistics, estimation, and …
Natural Resources Biometrics begins with a review of descriptive statistics, estimation, and hypothesis testing. The following chapters cover one- and two-way analysis of variance (ANOVA), including multiple comparison methods and interaction assessment, with a strong emphasis on application and interpretation. Simple and multiple linear regressions in a natural resource setting are covered in the next chapters, focusing on correlation, model fitting, residual analysis, and confidence and prediction intervals. The final chapters cover growth and yield models, volume and biomass equations, site index curves, competition indices, importance values, and measures of species diversity, association, and community similarity.
The students will play a classic game from a popular show. Through …
The students will play a classic game from a popular show. Through this they will see the probabilty that the ball will land each of the numbers with more accurate results coming from repeated testing.
Over several days, students learn about composites, including carbon-fiber-reinforced polymers, and their …
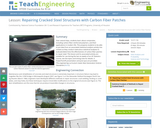
Over several days, students learn about composites, including carbon-fiber-reinforced polymers, and their applications in modern life. This prepares students to be able to put data from an associated statistical analysis activity into context as they conduct meticulous statistical analyses to evaluate/determine the effectiveness of carbon fiber patches to repair steel. This lesson and its associated activity are suitable for use during the last six weeks of an AP Statistics course; see the topics and timing note for details. A PowerPoint® presentation and post-quiz are provided.
As if they are engineers, students are tasked to design solar-powered model …
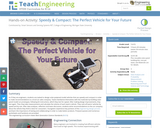
As if they are engineers, students are tasked to design solar-powered model vehicles that are speedy and compact in order to make recommendations to a local car sales company. Teams familiarize themselves with the materials by building solar-panel model car prototypes, following kit instructions, which they test for speed. After making design improvements, they test again. Then they take measurements and calculate the volume of each team’s vehicle. They rank all teams’ vehicles by speed and by size. After data analyses, reflection and team discussion, students write recommendations to the car company about the vehicle they think is best for consumers. Youngsters experience key portions of the engineering design process and learn the importance of testing and collaborating in order to make better products. Pre/post-quizzes and numerous worksheets and handouts are provided.
Students are introduced to the technology of flexible circuits, some applications and …
Students are introduced to the technology of flexible circuits, some applications and the photolithography fabrication process. They are challenged to determine if the fabrication process results in a change in the circuit dimensions since, as circuits get smaller and smaller (nano-circuits), this could become very problematic. The lesson prepares students to conduct the associated activity in which they perform statistical analysis (using Excel® and GeoGebra) to determine if the circuit dimension sizes before and after fabrication are in fact statistically different. A PowerPoint® presentation and post-quiz are provided. This lesson and its associated activity are suitable for use during the last six weeks of the AP Statistics course; see the topics and timing note for details.
Students apply pre-requisite statistics knowledge and concepts learned in an associated lesson …
Students apply pre-requisite statistics knowledge and concepts learned in an associated lesson to a real-world state-of-the-art research problem that asks them to quantitatively analyze the effectiveness of different cracked steel repair methods. As if they are civil engineers, students statistically analyze and compare 12 sets of experimental data from seven research centers around the world using measurements of central tendency, five-number summaries, box-and-whisker plots and bar graphs. The data consists of the results from carbon-fiber-reinforced polymer patched and unpatched cracked steel specimens tested under the same stress conditions. Based on their findings, students determine the most effective cracked steel repair method, create a report, and present their results, conclusions and recommended methods to the class as if they were presenting to the mayor and city council. This activity and its associated lesson are suitable for use during the last six weeks of the AP Statistics course; see the topics and timing note for details.
Working as if they are engineers aiming to analyze and then improve …
Working as if they are engineers aiming to analyze and then improve data collection devices for precision agriculture, students determine how accurate temperature sensors are by comparing them to each other. Teams record soil temperature data during a class period while making changes to the samples to mimic real-world crop conditions—such as the addition of water and heat and the removal of the heat. Groups analyze their collected data by finding the mean, median, mode, and standard deviation. Then, the class combines all the team data points in order to compare data collected from numerous devices and analyze the accuracy of their recording devices by finding the standard deviation of temperature readings at each minute. By averaging the standard deviations of each minute’s temperature reading, students determine the accuracy of their temperature sensors. Students present their findings and conclusions, including making recommendations for temperature sensor improvements.
In order to promote students’ conceptual understanding and learning experience in introductory …
In order to promote students’ conceptual understanding and learning experience in introductory statistics, a technology task, which focuses on the probability distribution in which means are defined, was created using TinkerPlots, an exploratory data analysis and modeling software. The targeted audiences range from senior high school grade levels to college freshmen who are starting their introductory course in statistics. Students will be guided to explore and discover the movement behaviors of means of a set of numbers randomly generated from a fixed range of values characterized by a predetermined probability distribution. The cognitive, mathematical, technological and pedagogical natures of the task, as well as its association with the statistics education framework based on the Guidelines for Assessment and Instruction in Statistics Education (GAISE) by the American Statistical Association, will be elaborated. A brief discussion on what cognitive design principles this task satisfies will also be provided at the end.
Students collect a large set of data (approximately 60 sets) of individual …
Students collect a large set of data (approximately 60 sets) of individual student’s water use and learn how to use spreadsheets to graph the data and find mean, median, mode, and range. They compared their findings to the national average of water use per person per day and use it to evaluate how much water a municipality would need in the event of a recovery from a water shutdown. This analysis activity introduces students to the concept of central tendencies and how to use spreadsheets to find them.
These open-source mathematics homework problems are programmed for the WeBWorK mathematics platform …
These open-source mathematics homework problems are programmed for the WeBWorK mathematics platform and correspond to chapters in OpenStax Introductory Statistics. They were created through a Round Eight Textbook Transformation Grant.
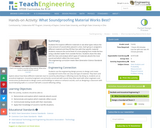
Students first explore different materials to see what types reduce the most …
Students first explore different materials to see what types reduce the most amount of sound when placed in a box. Each group is assigned a different material and they fill their box with that specific material. Students measure the sound level of a tone playing from inside the box using a decibel reader from outside the box. Students share this data with the class and analyze which types of materials absorb the most sound and which reflect the most sound.
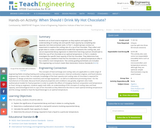
Students act as food science engineers as they explore and apply their …
Students act as food science engineers as they explore and apply their understanding of cooling rate and specific heat capacity by completing two separate, but interconnected, tasks. In Part 1, student groups conduct an experiment to explore the cooling rate of a cup of hot chocolate. They collect and graph data to create a mathematical model that represents the cooling rate, and use an exponential decay regression to determine how long a person should wait to drink the cup of hot chocolate at an optimal temperature. In Part 2, students investigate the specific heat capacity of the hot chocolate. They determine how much energy is needed to heat the hot chocolate to an optimal temperature after it has cooled to room temperature. Two activity-guiding worksheets are included.
No restrictions on your remixing, redistributing, or making derivative works. Give credit to the author, as required.
Your remixing, redistributing, or making derivatives works comes with some restrictions, including how it is shared.
Your redistributing comes with some restrictions. Do not remix or make derivative works.
Most restrictive license type. Prohibits most uses, sharing, and any changes.
Copyrighted materials, available under Fair Use and the TEACH Act for US-based educators, or other custom arrangements. Go to the resource provider to see their individual restrictions.